 English
 Español
 русский
 中文简体
中文简体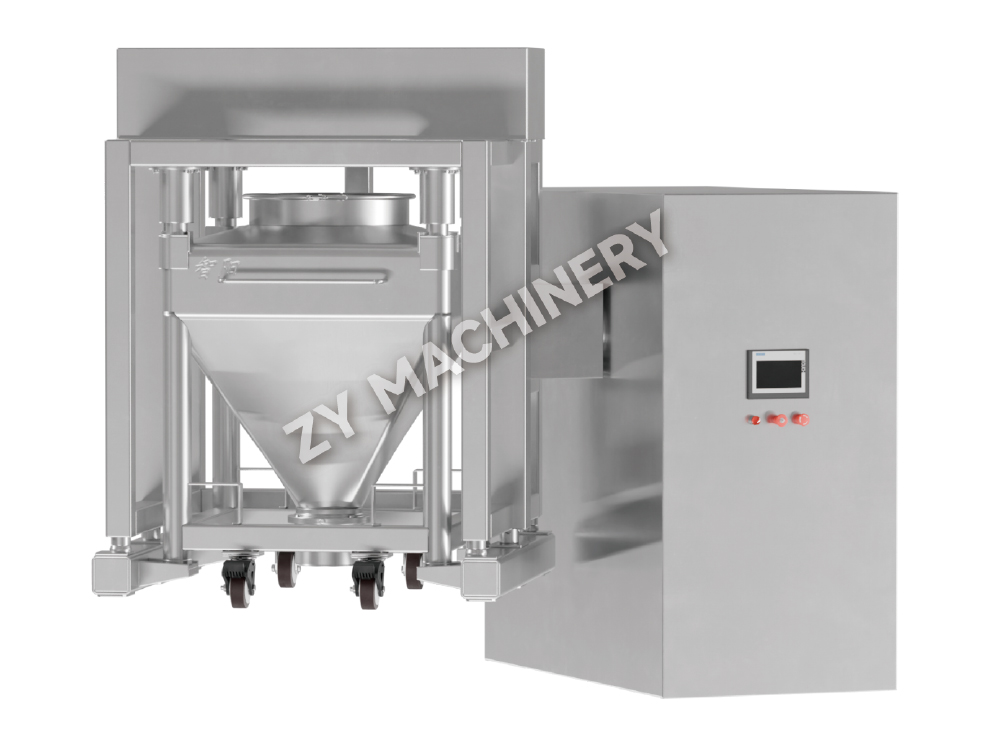
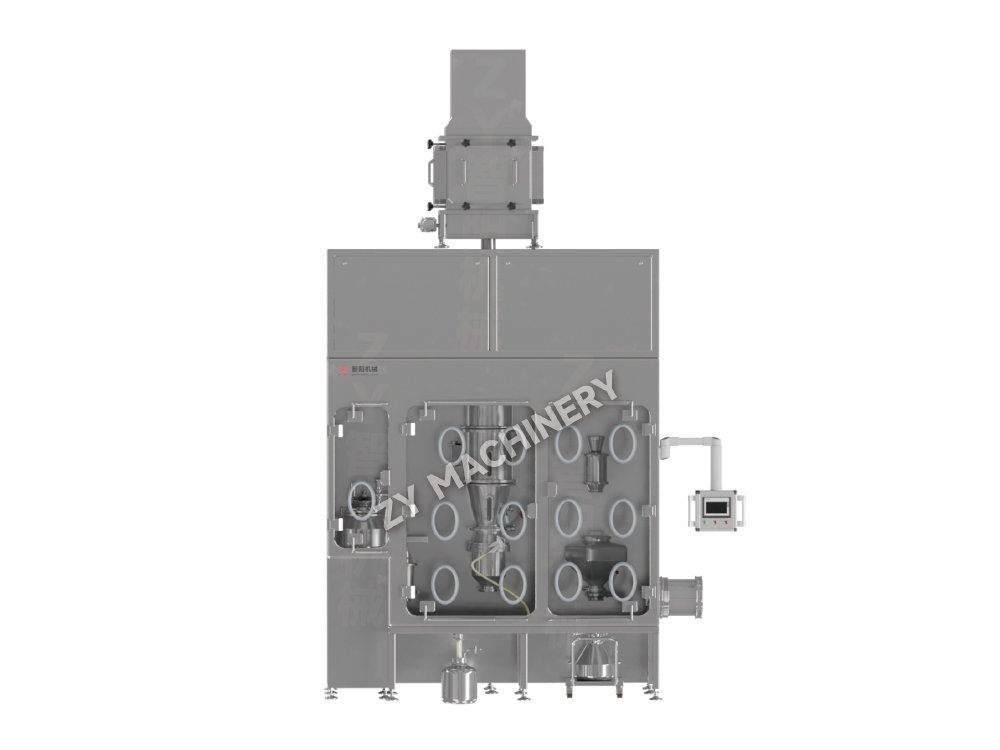
AH Airflow Mixer
The AH Airflow Mixer is specifically designed to meet the batch mixing requ.....

Content
A single failed cleaning validation run can freeze an entire oral solid dosage line for weeks. The investigation rarely ends with the cleaning procedure. More often than not, the root cause traces back to equipment qualification gaps — a spray ball that was never mapped during IQ, or a weld seam roughness value that exceeded the OQ acceptance criteria. Cleaning validation and equipment qualification are not parallel tracks; they are deeply interdependent. If you cannot prove your mixer, granulator, or coater was installed and operates consistently, any residue limit you set sits on an unreliable foundation.
The 2026 version of WHO TRS 1019 Annex 3 reinforces this by stating that cleaning validation protocols must reference the equipment’s design, installation, and operational qualification documents. In practice, that means every DQ, IQ, OQ, and PQ report becomes a prerequisite for your cleaning validation master plan. The following sections walk you through exactly where these two domains intersect, using real-world equipment types and validation parameters that regulators expect to see.
Without a properly qualified piece of equipment, any residue data you collect is scientifically ambiguous. Consider an OQ test for a high-shear granulator that didn’t measure water flow rate through the clean-in-place ports. If later swab samples inside the bowl show peak residues near a nozzle, you have no baseline to determine whether the cleaning sequence underperformed or the equipment delivery system was flawed from the start. Qualification builds the frame; cleaning validation fills in the picture.
DQ records the material of construction, surface finish, and drainability — all factors that directly impact residue carryover. IQ verifies that spray devices are correctly positioned, that no dead legs exist, and that slope meets the 1:100 minimum recommended in ISPE’s Good Practice Guide. OQ must document spray coverage patterns, temperature ramps, and pressure drops at worst-case locations. PQ, often performed with a placebo or surrogate soil, confirms that the cleaning cycle delivers consistent residue removal under load. Missing a single parameter in any of these stages can later appear as an unexplained spike in a TOC rinse sample.
For a structured approach, map each qualification phase to the cleaning-specific data you need to collect:
This alignment turns equipment qualification from a checkbox exercise into a risk-reduction tool. When an auditor asks why a particular swab location was chosen, you can point back to the OQ coverage map that identified a shadow zone behind the chopper blade.
Not all oral solid dosage equipment presents the same cleaning risk. The geometry, surface complexity, and movement of internal parts determine where residues accumulate and how sampling should be designed. A generic cleaning protocol that treats a tumble mixer and a fluid bed coater identically will inevitably miss critical contamination points.
Three equipment categories dominate OSD manufacturing, and each introduces distinct validation challenges:
| Equipment Type | Common Dead Zones | Recommended Sampling Points | Cleaning Difficulty |
|---|---|---|---|
| Bin / Tumble Mixers | Discharge valve seat, shaft seals, sight glass flanges | Valve interior, seal lip, dome of the container | Medium |
| High-Shear Granulators | Chopper blade hub, bowl-to-lid gasket, impeller undercuts | Hub underside, gasket crevice, impeller root | High |
| Fluid Bed Dryers / Coaters | Distribution plate holes, exhaust plenum, product filter bag housing | Perforated plate underside, plenum weld seams, bag ring | High |
For bin mixers, the main risk is the discharge valve. Even with full opening, static residues can cling to the metal-to-metal seat and later fall into the next batch. IQ therefore must confirm that the valve can be fully dismantled for cleaning and that the seat surface roughness meets the DQ specification. For high-shear granulators, the chopper blade hub creates a shielded zone; swab sampling at the hub underside is non-negotiable. In fluid bed systems, the distribution plate often acts as a residue trap, and rinse sampling alone is insufficient because the plate’s high surface area can retain particulate that dissolves only partially during a short water rinse.
When selecting equipment, giving preference to those with electropolished surfaces, minimal horizontal surfaces, and fully drainable design lowers the cleaning validation burden substantially. Features like removable sight glasses and clamp-on spray nozzles directly reduce the number of hard-to-clean areas. Investing in cleanability at the DQ stage cuts the number of swab locations by up to 40% compared to retrofitted older equipment.
The most contentious part of any cleaning validation protocol is setting the acceptance criteria. The logic diverges sharply depending on whether the equipment is dedicated to a single product or shared across multiple formulations.
Dedicated equipment allows a more targeted approach. You can use a Permitted Daily Exposure (PDE) or Acceptable Daily Exposure (ADE) value based on the toxicological profile of that single active ingredient. The limit calculation typically follows the “Minimal Therapeutic Dose” fraction or the 1/1000th dose criterion, whichever is lower. For example, if the PDE is 10 µg/day and the maximum daily dose of the next product is 500 mg, the surface limit becomes 2 µg/cm² assuming a 100 cm² swab area. This approach reflects actual patient risk rather than a generic worst-case.
Non-dedicated equipment demands a more conservative calculation because the residue could come from multiple previous campaigns. Here, you must identify the worst-case product — the one with the lowest PDE, highest potency, or most difficult solubility profile — and base limits on that compound. In addition, you need to factor in the batch size of the subsequently manufactured product and assume that all residual API transfers entirely. Multi-product facilities often target a visual cleanliness limit of 4 µg/cm² as a starting point, but verification through recovery studies must confirm that the limit is achievable and analytically detectable.
| Approach | Applicable Scenario | Data Source | Typical Acceptance Criterion |
|---|---|---|---|
| PDE / ADE Based | Dedicated equipment, known toxicology | Toxicological monographs, EMA guideline | ≤ 2 µg/cm² or 1/1000th dose |
| Worst-Case Product | Multi-product, shared equipment | Cleaning validation master plan, PDE matrix | ≤ 4 µg/cm² or visual clean, whichever is lower |
| Default TOC Limit | Initial feasibility, early development | Water quality + historical data | ≤ 5–10 ppm TOC in final rinse |
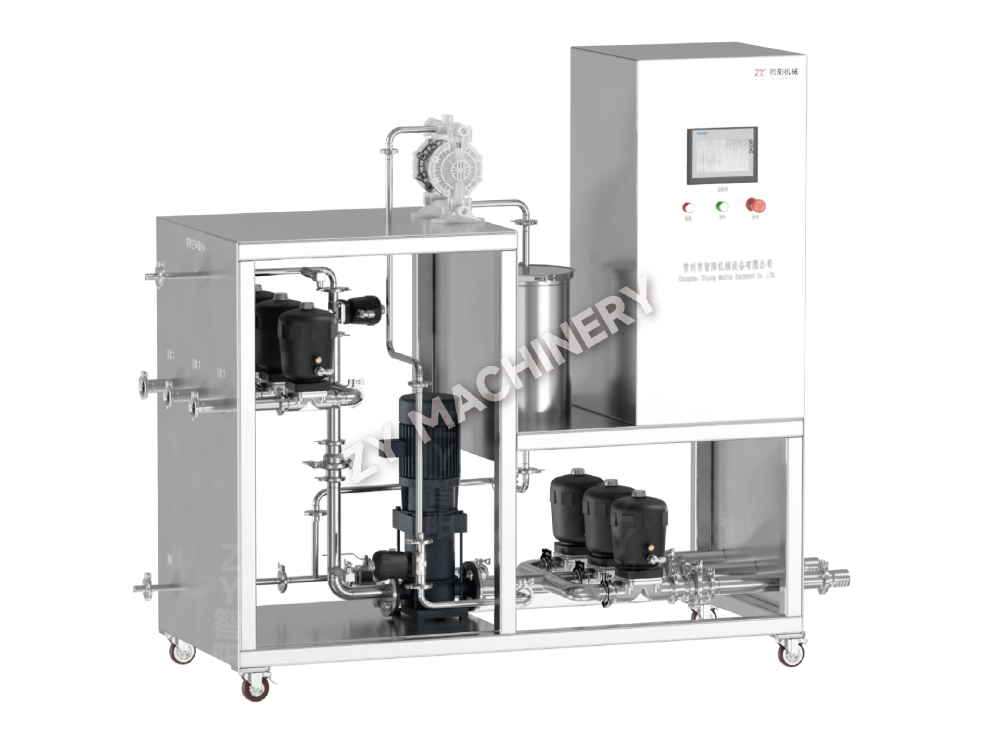
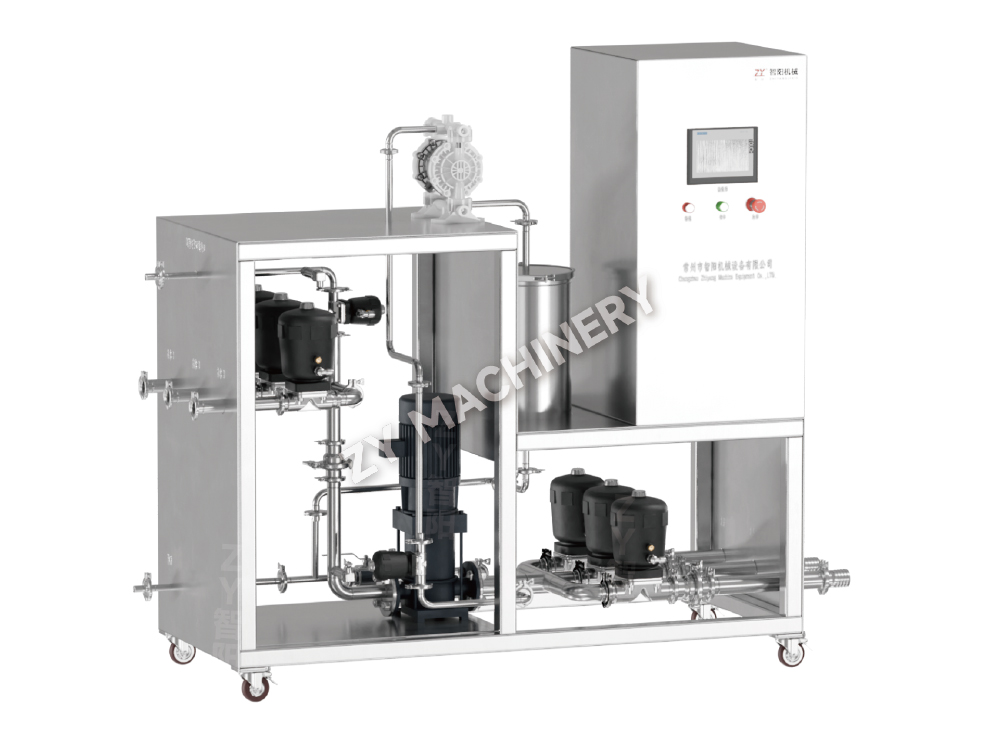
Regardless of the method, the limit must be achievable with the installed cleaning system. If a mobile CIP station like the QWQY mobile CIP cleaning station is paired with a 500 L blender, the spray coverage data from OQ must demonstrate that the nozzle can reach every surface within the 2 µg/cm² band. Otherwise, the limit becomes theoretical and non-defendable during an audit.
Choosing the wrong sampling method undermines even the most rigorous qualification data. Each technique has a specific recovery efficiency, detection limit, and material compatibility that must align with the residue type and equipment surface.
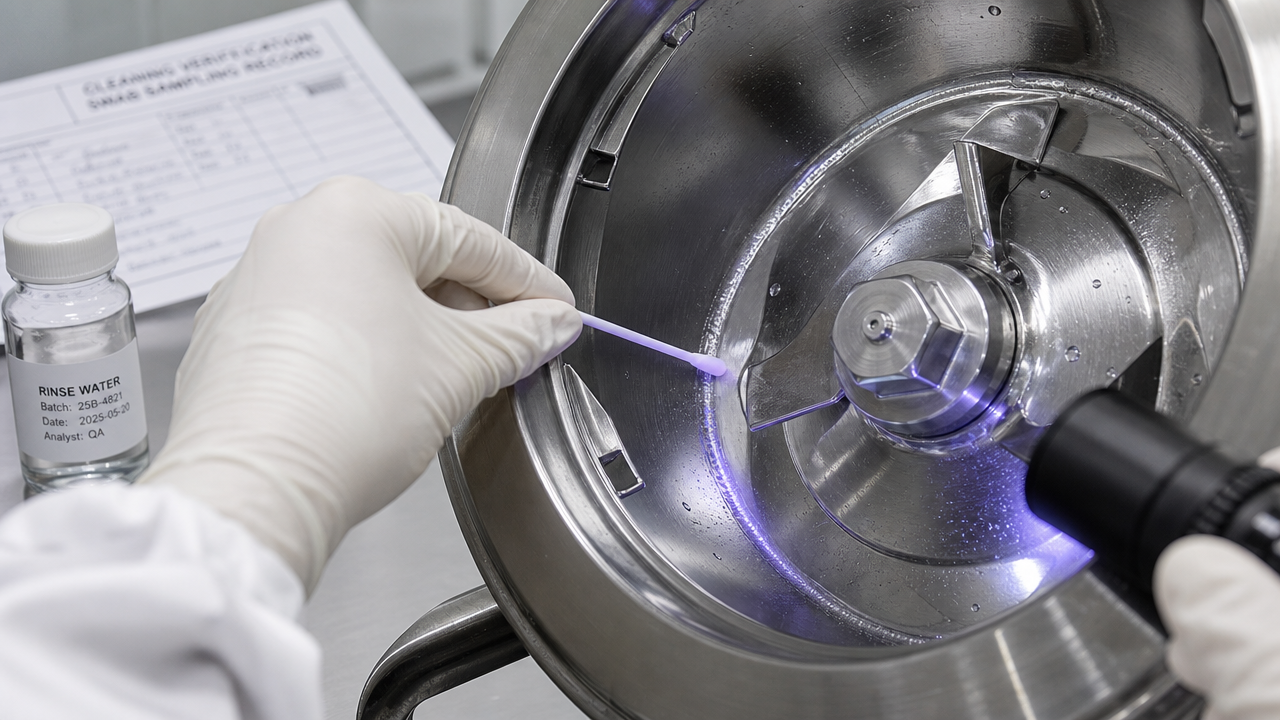
Swab sampling remains the gold standard for direct surface residue measurement, especially on stainless steel equipment. With proper pre-wetted swabs and validated recovery factors (typically 70–90% for small-molecule APIs), you can pinpoint hot spots near gaskets or shafts. Rinse sampling, on the other hand, covers large internal volumes — like a granulator bowl or dryer plenum — but only detects residue soluble in the rinse solvent and reachable by the fluid path. Contact plates are mainly reserved for microbiological monitoring after cleaning, though they can serve as a supplementary method for gross residue detection when paired with ATP bioluminescence.
| Method | Typical Recovery Range | Detection Limit | Best Used On | Key Limitation |
|---|---|---|---|---|
| Swab | 70–90% | 0.1–1 µg/cm² | Smooth SS, elastomer seals | Surface area standardization |
| Rinse | 50–85% | 1–5 ppm in solution | Pipes, vessel interiors | Insoluble residues pass undetected |
| Contact Plate | N/A (microbial) | 1 CFU/25 cm² | Flat, non-antibiotic surfaces | Not suitable for chemical residue alone |
The recovery factor for swab testing must be experimentally determined for each surface material and each compound. A rougher cast surface on an older dryer, for instance, can reduce recovery to below 50%, forcing you to adjust the acceptance limit accordingly. In automated cleaning equipment systems, supplementing rinse data with a conductivity or TOC online probe provides continuous trend data that complements spot swab checks.
Automated clean-in-place systems, whether fixed or mobile, demand a validation approach that goes far beyond a simple time-and-temperature recipe. The interaction between spray device geometry, pipe diameter, and pump capacity determines whether the cleaning fluid actually strikes every product-contact surface with enough mechanical force to dislodge residue.
The four critical CIP parameters that must be qualified and documented for cleaning validation are:
Documentation of a CIP validation run should include trend charts for temperature, pressure, and conductivity from the PLC historian, as well as before-and-after visual inspection photographs of the worst-case locations. A ribbon test — where a heat-sensitive ribbon is applied to the internal vessel surface and examined after the CIP cycle — provides irrefutable proof of mechanical reach. For automated bin washers like the QD automatic bin washing machine, the spray arm rotation speed and nozzle integrity must become part of the preventive maintenance and requalification schedule, because nozzle wear directly degrades coverage.
Without continuous monitoring of rinse conductivity in the final rinse, you risk accepting a clean signal that results from a momentary dilution spike rather than true residue removal. A plateau of conductivity equal to the incoming water quality for at least 30 seconds is the minimum evidence for a complete rinse.
When active pharmaceutical ingredients fall into OEB 4 or 5 categories, the cleaning validation protocol must simultaneously protect the operator while proving that product residue is removed. The combination of isolation technology and potent compounds creates a unique set of validation demands that standard OSD protocols do not address.
Inside an isolator or downflow booth, cleaning validation sampling must be performed under negative pressure, often through glove ports. This restricted access influences swab site selection because some surfaces — like the back side of a fast-transfer port — become inaccessible without breaching containment. In such cases, a combination of rinse sampling and indirect assessment via fluorescent tracer surrogate becomes acceptable if justified in the protocol.
Additionally, the cleaning agent itself must be contained. CIP-in-place on high-containment equipment often uses single-pass rinses rather than recirculation to avoid cross-contamination of the CIP loop with potent residue. Validation therefore must demonstrate that the rinse volume and contact time are sufficient to achieve the target carryover limit despite the inherent inefficiency of once-through flows. Fluorescent tracer tests with a riboflavin solution under black light are considered the gold standard for verifying spray coverage and absence of residue shadows inside a sealed isolator.
For facilities using high-containment laboratory equipment, the sampling plan must also consider the ventilation system. Swabbing of the HEPA filter housing or the RTP (rapid transfer port) flange can become necessary if the airflow pattern suggests potential dust accumulation. The cleaning validation report must cross-reference the containment performance tests to prove that no aerosolized residue escaped during the cleaning cycle itself.
Initial validation runs are a snapshot. Ongoing monitoring transforms cleaning validation into a life-cycle program. Stage 3, or continued process verification, is where many facilities falter — they treat the validated state as static, ignoring gradual shifts in equipment condition or product portfolio.
The core monitoring metrics that sustain cleaning validation health include:
When a new product must run on existing non-dedicated equipment, a bracketing strategy can minimize rework. By evaluating the new compound’s solubility, potency, and adsorption profile against the existing worst-case, you may only need to update the cleaning validation master plan and perform a single confirmatory swab study rather than three full batches. However, any modification to the equipment itself — such as changing a spray ball design or adding a new vessel port — automatically reopens both IQ and OQ, and by extension, the cleaning validation protocol tied to that equipment. The link between qualification and cleaning never breaks; it just requires disciplined maintenance.
Want to stay up to date?
Contact us via the email address below.
Don't worry about spam. We hate it too!
Mobile Client

Video Account
Phone:+86-15161130178
Tel:+86-519-88674267
Email:czzy188@163.com
Phone:+86-15161132798
Email:zy@zy-drying.com

WeChat ID

Copyright 2026 Changzhou Zhiyang Machinery Equipment Co., Ltd. All Rights Reserved  Oral Solid Dosage Equipment Manufacturer